
Limited signs of spillovers to non-energy shipping (so far)
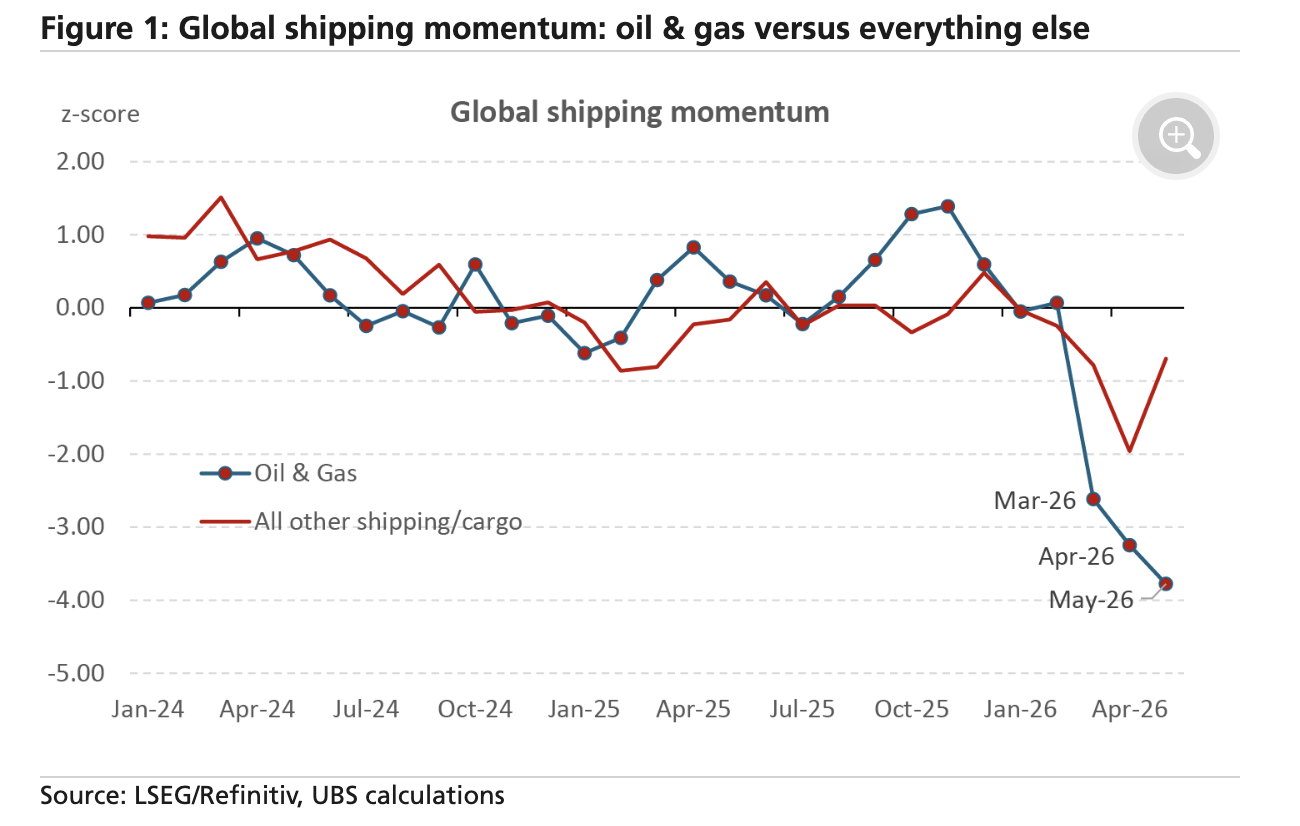
In our April 30 note we showed how global oil/gas shipping traffic had fallen by 13% from pre-Middle East conflict levels—closely matching the disruption through the Strait of Hormuz—and how the various regions were trying to reroute ships to find alternative energy supplies. Today’s chart examines whether that energy shock is spilling over into broader shipping activity. A key question is whether fuel shortages are beginning to weigh on overall trade flows, providing an additional transmission channel to global supply chains. PMI delivery times have already lengthened by around 1¾ standard deviations, but it remains unclear how much reflects product shortages versus shipping constraints.
The chart shows our “momentum” measure of global shipping traffic—defined as tonnes of cargo multiplied by nautical miles travelled per day. We’ve aggregated the daily data at a monthly frequency (May is the average of the daily data month-to-date), and standardize using z-score over the full sample. Oil and gas shipping has continued to deteriorate, now around 4 standard deviations below normal. By contrast, non-energy shipping weakened through April (-2 standard deviations) but has partially recovered in May (now around -0.7 standard deviations). In level terms, non-energy related shipping/cargo traffic fell 5% in March (vs the prior 12m average) and 13% in April but is now back to just 4% below normal. In Asia—where energy shortages appear most acute—non-energy volumes were 10% below normal in April but are now running slightly above normal. In the Gulf, however, non-energy shipping remains severely disrupted (around 83% below normal), reflecting the broader impact of the Strait of Hormuz bottleneck on both energy and non-energy flows.