
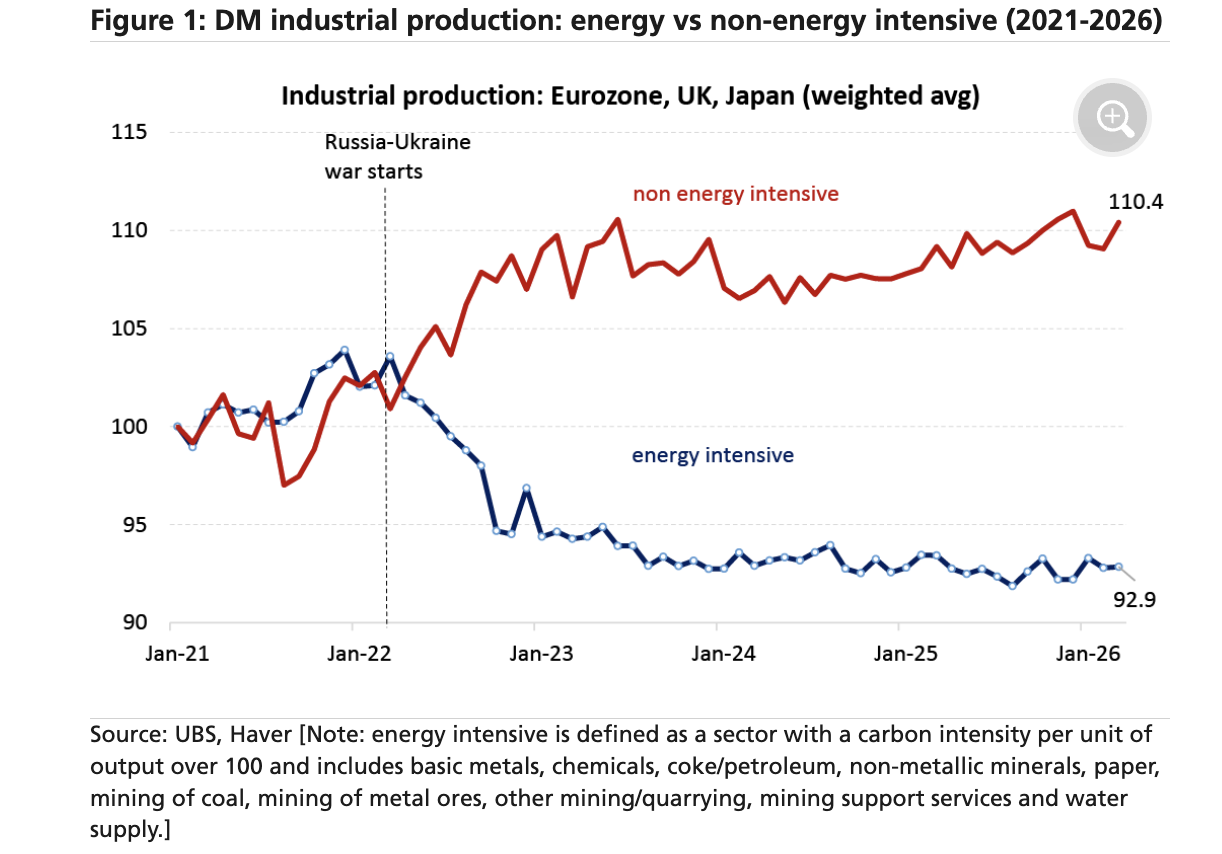
Rotation away from energy intensive production cushioned GDP in ’22
We only have partial industrial production data through April, so it is too early to assess the impact of the current energy disruption. However, the lingering effects of the 2022 crisis remain clearly visible in the data. A striking feature of the 2022–23 episode was that, despite a 21% decline in gas consumption in the Eurozone, GDP barely contracted. How can that be explained? A key factor was a shift in activity away from energy-intensive sectors towards less energy-intensive production, as shown in today’s chart (see also Plekhanov and Sassoon, 2023). Germany provides a useful illustration. Chemicals output fell by 21%, subtracting 1.6pp from industrial production while generating gas savings equivalent to 2.9% of baseline consumption. At the same time, the automotive sector—much less energy intensive—expanded output by 17%, adding 2.8pp to industrial production while increasing gas demand by only 0.5pp. These substitution effects were central to cushioning the macro impact of the shock and are likely to be an important determinant of how the current disruption feeds through to activity. As today’s chart shows, a sizeable wedge—around 17pp—opened up across the euro area, UK and Japan between non-energy-intensive and energy-intensive production. Notably, that gap has yet to close.
 Προσθήκη του MarketsReport.gr στην Google