CITI’S TAKE
Global equities are near all-time highs, with signs of growing exuberance. Against this backdrop, we revisit our Bear Market Checklist (BMC), which helps gauge underlying market risks and whether dips should be bought or avoided. The BMC is now at its frothiest level since the GFC, with flags rising steadily. However, it does not yet signal “overexuberance”, remaining below levels seen ahead of past bear markets. We therefore remain constructive on global equities for now, while acknowledging that risks are building.
Exuberance Building — Global equities have continued to climb, accompanied by clearer signs of exuberance. Valuations across several segments appear stretched, investor sentiment is turning increasingly optimistic, and the pickup in IPOs and broader equity issuance highlights strong demand for risk. None of this, on its own, signals an imminent downturn. History suggests that major peaks aren’t defined by a single trigger, but by a broad set of indicators all moving into more extreme territory at the same time.
Revisiting the Bear Market Checklist (BMC) — Against this backdrop, we revisit our proprietary Bear Market Checklist (BMC), which help measures the level of froth in equity markets. It is not designed as a market timing tool or to predict when corrections will start or end. Instead, it provides a framework to guide decision-making during market pullbacks and to highlight when underlying conditions are becoming more concerning.
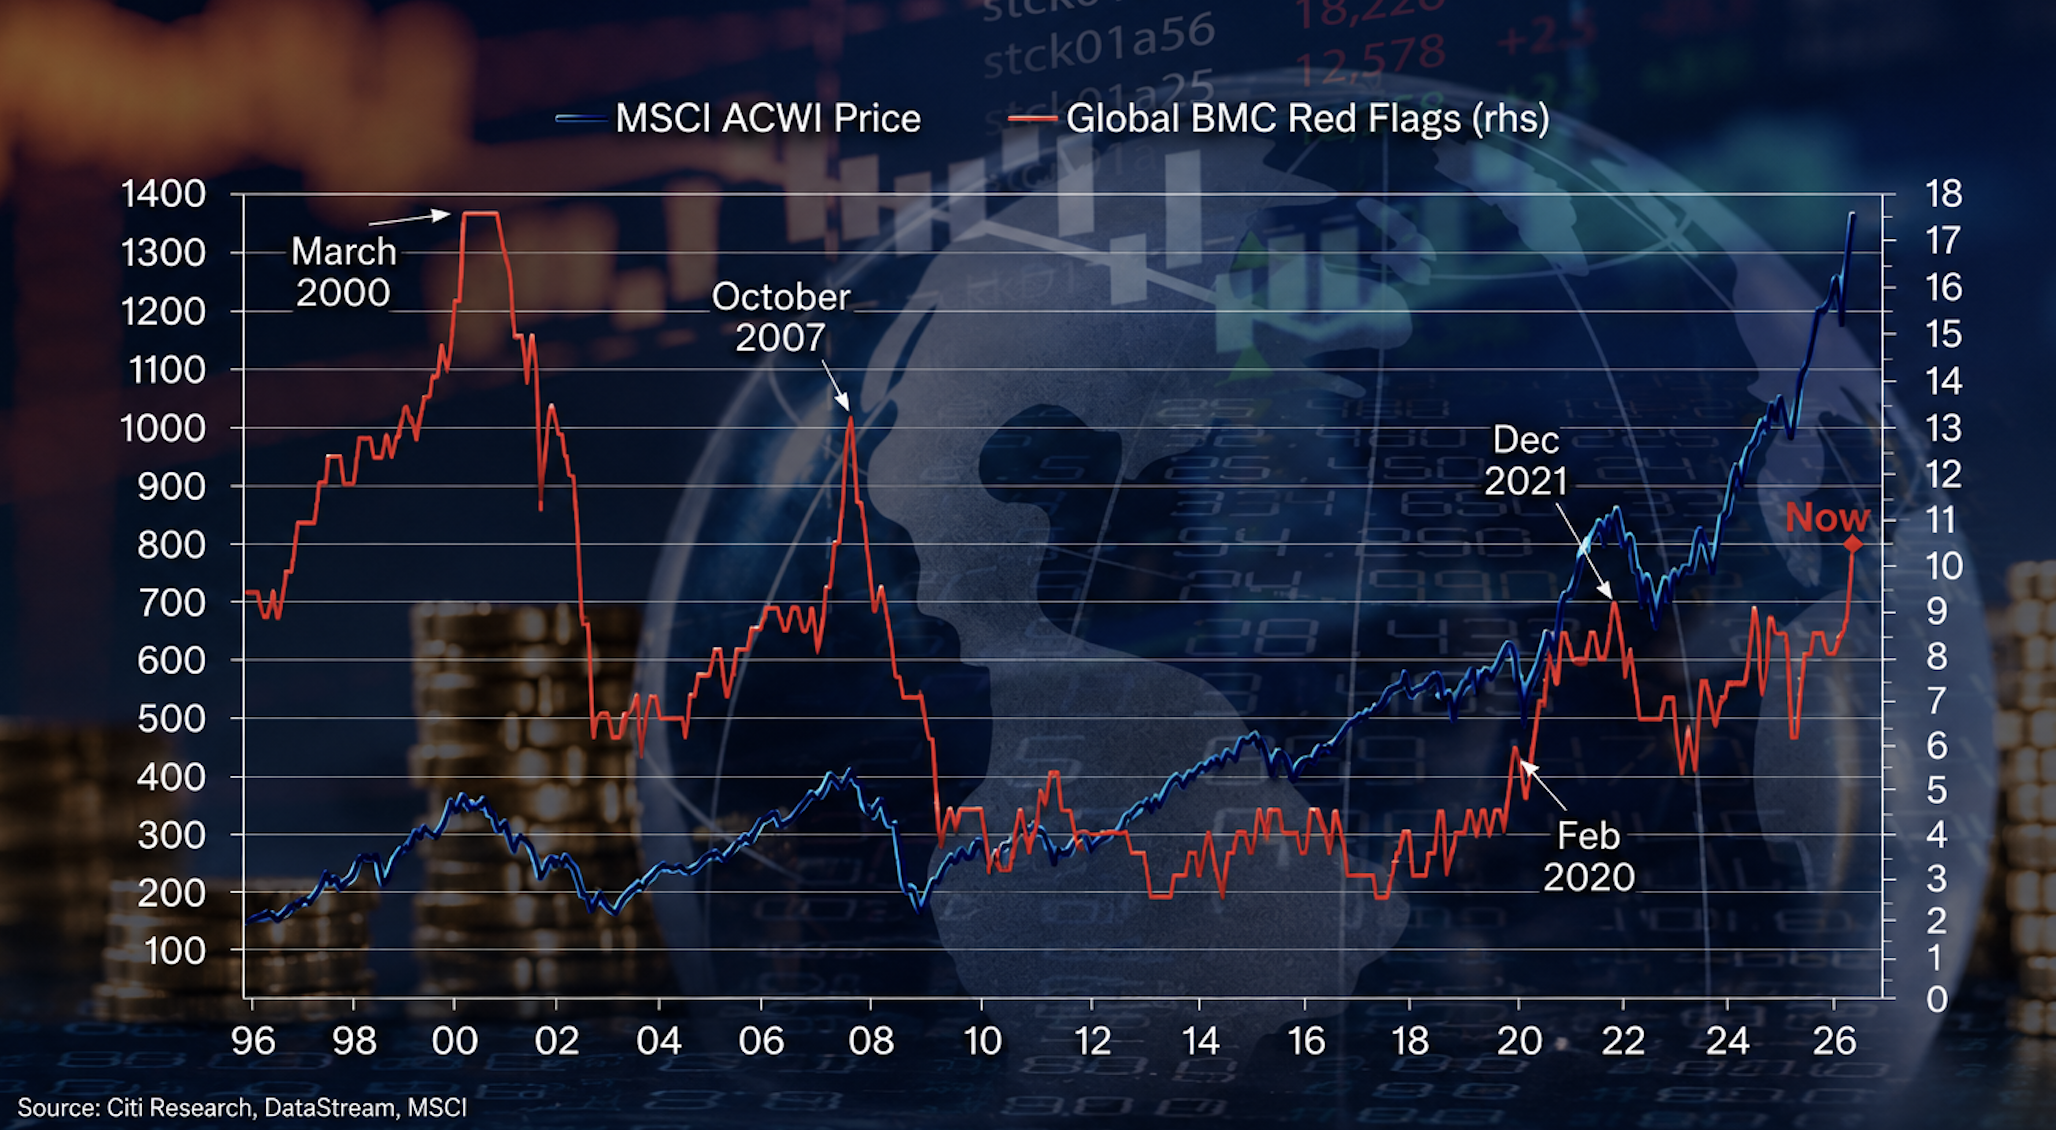
BMC at Post-GFC Highs — Our global BMC now stands at 10/18 flags (US: 11.5/18, Europe: 5/18). This is the highest number of flags for the global BMC since the GFC, indicating increasingly frothy conditions. This remains less extreme than BMC peaks heading into past bear markets. For example, the BMC rose to 17.5/18 flags in 2000 and 13/18 flags pre-GFC.
Key Indicators and Emerging Risks — Several factors are contributing to the recent rise in BMC flags, including strong global EPS growth and increased fund flows. However, we are also seeing elevated capex growth, particularly in AI, and a rise in equity issuance, pushing the IPO activity factor into cautionary territory. Credit spreads remain tight, sending a more positive signal.
Hot But Not Overexuberant Yet — Although the number of red flags is increasing, the BMC does not yet indicate a state of pronounced overexuberance. We therefore remain constructive on equity markets to year-end. That said, we recognize that once the count reaches double digits, it has historically tended to rise more rapidly, signaling a potential acceleration in risk. Should more flags continue to turn on, this would increasingly signal that dips should not necessarily be bought.
BMC: Exuberance Building
Global equities are making new all-time highs, while exhibiting some clear signs of exuberance. Valuations in many areas look stretched, sentiment is increasingly optimistic, and the pickup in IPOs/equity issuance points to strong demand for risk, a pattern typically seen in later-cycle environments. None of this, on its own, signals an imminent downturn. Indeed, history suggests that major peaks aren’t defined by a single trigger, but by a broad set of indicators all moving into more extreme territory at the same time.
Against this backdrop, we revisit our proprietary Bear Market Checklist (BMC). This tool has long helped us assess how much risk is building beneath the surface in equity markets, and whether the next dip should be treated as an opportunity or a warning sign. Ultimately, the BMC has reached its frothiest levels of the post-GFC period. But even with the number of flags rising steadily, the BMC is not yet signaling overexuberance. We therefore remain constructive on global equities for now, while acknowledging that warning signs are rising.
BMC: How Does it Work?
Our global Bear Market Checklist (BMC) looks at 18 different factors including equity valuation, sentiment, credit spreads, yield curves, fund flows, corporate fundamentals and financing activity. Based on historical trends, we have previously established thresholds where caution is due. After crossing an initial threshold, the factor turns amber. Should froth continue to build, the factor will then turn red. We can then total up the number of “flags” (one full point for those in red territory and one-half point for those in amber).
Our global Bear Market Checklist (BMC) is not designed as a market timing tool or to predict when corrections will start or end. Instead, it provides a framework to guide decision-making during market pullbacks and to highlight when underlying conditions are becoming more concerning. As the number of warning signals rises toward double digits, it becomes a clear prompt for greater caution.
At any one time, some BMC factors might be giving warning signs, but usually not enough in aggregate to suggest turning long-term bearish. It is only at the frothiest market peaks (2000, 2007) that most factors are providing a sell signal. Those were the dips that should not have been bought.
BMC: What Does It Say Now?
The Global BMC is currently flashing 10/18 red flags and is currently at its highest level since the GFC (Figures 1-2). On a regional level, the US BMC (11.5/18) looks much frothier than the Europe’s BMC (5/18).
Some factors e.g., ROEs and PE multiples) have been elevated for some time, but many are just getting hotter. Capex growth has risen significantly, mostly attributable to AI hyperscalers. The announced/expected IPOs of several megacap US companies pushed the global IPO factor into amber category for now. Global EPS is getting stronger, and sentiment is picking up (via stronger flows, bullish stock analysts, and a “euphoric” Levkovich indicator). While the yield curve has also started to flatten YTD, some other fast-paced indicators like credit spreads still remain tight, sending a more positive signal. This could potentially change should there be more pronounced worries around the private credit space or AI capex-related debt issuance.
Overall, although the number of red flags is increasing, the BMC does not yet indicate a state of pronounced overexuberance. That said, we recognize that once the count reaches double digits, it has historically tended to rise more rapidly, signaling a potential acceleration in risk. Should more flags continue to turn on, this would increasingly signal that dips should not necessarily be bought.